CASE STUDY 2
Clinical Quality Performance & Population Health
Business Challenge
Palmetto Regional Health System (PRHS) sought greater visibility into clinical quality performance and population health metrics to better identify care gaps, monitor preventive screening compliance, evaluate patient risk, and reduce avoidable 30-day readmissions. Executive leadership required an interactive reporting solution capable of transforming patient-level clinical data into actionable insights that support quality improvement, population health management, and strategic decision-making.
Dashboards
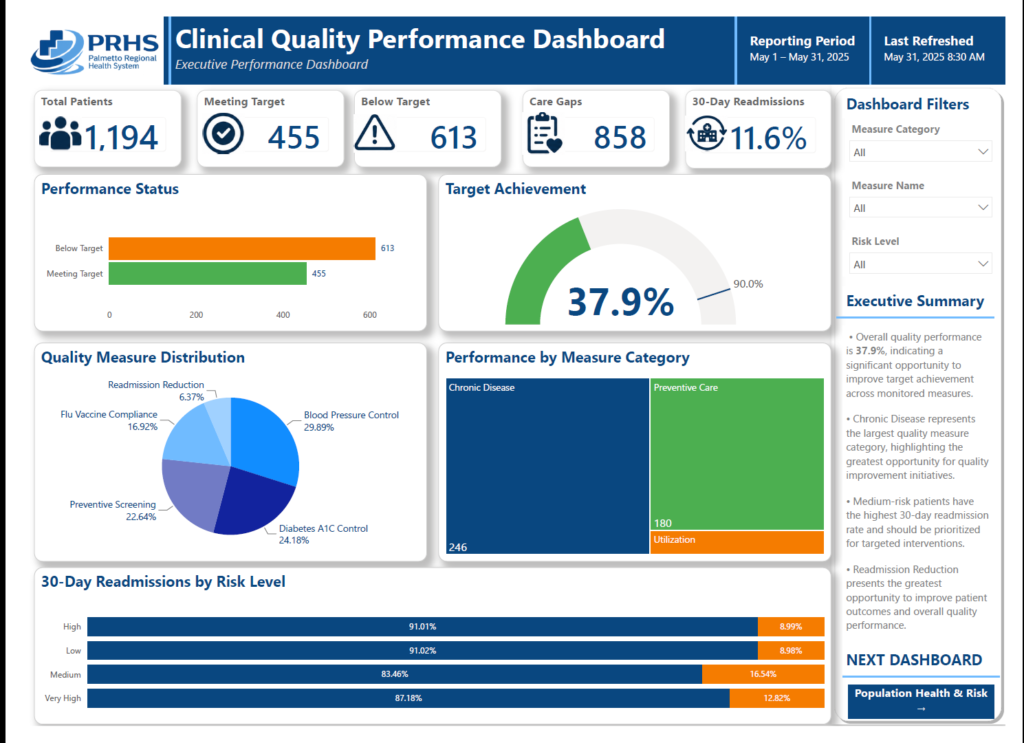
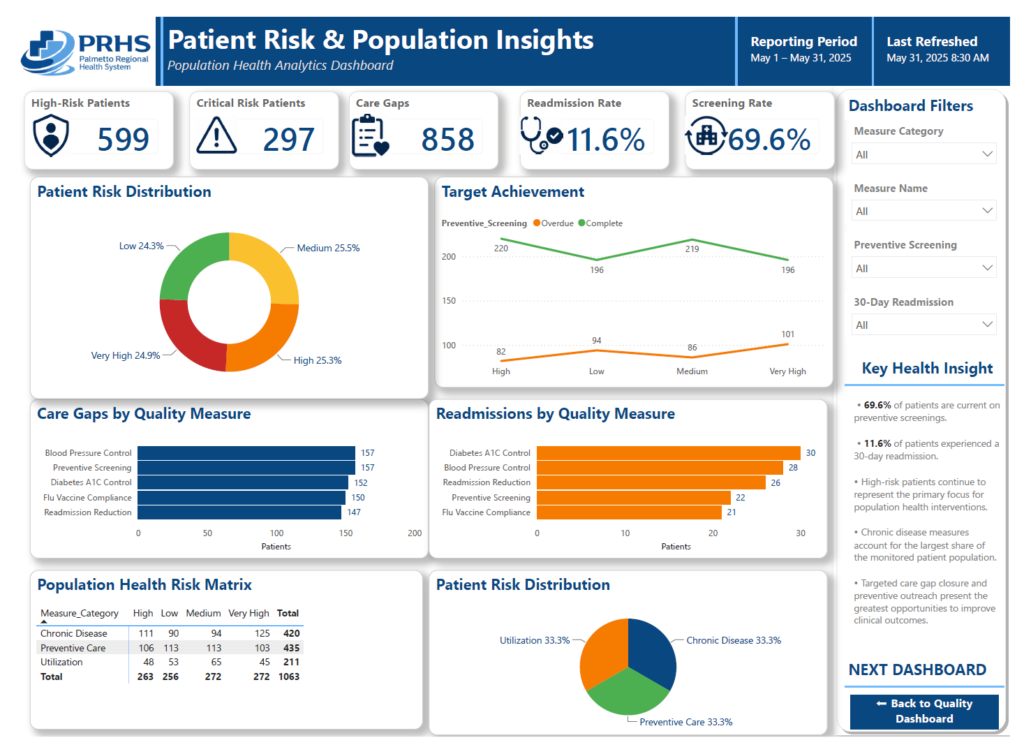
Explore interactive dashboards that analyze clinical quality performance, patient risk, preventive screening, care gaps, readmissions, and population health trends.
Technical Resources
This project was developed using Microsoft SQL Server, Power BI, and Excel. SQL was used for data preparation, ETL, validation, KPI calculations, and dashboard-ready reporting logic, while Power BI supported interactive clinical quality and population health analysis. The complete SQL scripts, validation queries, reporting datasets, and technical documentation are available in the GitHub repository.
Industry
Integrated Healthcare Services
Organization
Palmetto Regional Health System (PRHS) — Fictional
Focus Area
Clinical Quality & Population Health
Tools Used
Excel · SQL Server · Power BI
Framework
PDSA (Plan–Do–Study–Act)
Approach
Executive Leadership · Clinical Quality · Population Health
| Category | Details |
|---|---|
| Industry | Integrated Healthcare System |
| Organization | Palmetto Regional Health System (Fictional) |
| Focus Area | Clinical Quality & Population Health |
| Tools Used | Excel • SQL Server • Power BI |
| Framework | PDSA (Plan-Do-Study-Act) |
| Audience | Executive Leadership • Clinical Quality • Population Health |
An end-to-end healthcare analytics solution was developed using Excel-generated healthcare data, Microsoft SQL Server, and Power BI. Clinical quality, utilization, and population health data were modeled, validated, and transformed into executive dashboards that support KPI monitoring, quality improvement, and strategic decision-making.
Analysis identified elevated readmission rates, preventive screening gaps, and high-risk patient populations requiring targeted interventions.
Opportunities were identified to strengthen care coordination, improve preventive outreach, close quality gaps, and support value-based care initiatives.
Working with clinical and executive leadership, the project focused on improving clinical quality performance by addressing elevated readmission rates, preventive care gaps, and opportunities within high-risk patient populations. Key objectives, stakeholders, success measures, and quality KPIs were established to align the analysis with organizational goals and value-based care initiatives.
Clinical quality, utilization, and population health datasets were developed and validated using Microsoft SQL Server. Interactive Power BI dashboards were created to monitor quality measures, readmission rates, preventive screening performance, care gap closure, and high-risk patient populations, providing leadership with a centralized view of performance.
Dashboard analysis identified trends, performance gaps, and opportunities for improvement across multiple quality measures. High-risk patient populations, lower preventive screening rates, and elevated readmission rates were evaluated to understand contributing factors and prioritize improvement initiatives focused on care coordination, preventive outreach, and chronic disease management.
Based on the findings, strategic recommendations were developed to improve quality performance through targeted patient outreach, standardized preventive screening workflows, multidisciplinary care management, and ongoing executive performance monitoring. An implementation roadmap and KPI monitoring plan were established to support continuous improvement.
These recommendations support proactive population health management by improving preventive care, strengthening care coordination, reducing avoidable utilization, and enhancing clinical quality performance.
Executive dashboards and ongoing KPI monitoring enable leadership to measure progress and sustain continuous improvement.
This project demonstrates an end-to-end healthcare analytics and quality improvement methodology—from defining clinical quality challenges and developing a relational SQL database to building executive Power BI dashboards, evaluating outcomes through the PDSA cycle, developing strategic recommendations, creating an implementation roadmap, and establishing ongoing performance monitoring.
Implementation Roadmap
| Initiative | Priority | Owner | Timeline | Expected Outcome |
|---|---|---|---|---|
| High-risk patient outreach | High | Population Health | 30 Days | Reduce avoidable readmissions |
| Standardize preventive screening outreach | High | Clinical Operations | 60 Days | Increase screening compliance |
| Executive quality scorecards | High | Quality Improvement | 60 Days | Improve KPI visibility |
| Multidisciplinary care management | Medium | Care Management | 90 Days | Improve chronic disease outcomes |
| Quarterly quality reviews | Medium | Executive Leadership | Quarterly | Continuous improvement |
*Timeline represents estimated duration based on resource availability and priority.
Performance Monitoring Plan
| KPI | Baseline | Target | Frequency | Owner |
|---|---|---|---|---|
| 30-Day Readmission Rate | Dashboard | 15% Reduction | Monthly | Clinical Operations |
| Preventive Screening Rate | Dashboard | >85% | Monthly | Population Health |
| Care Gap Closure | Dashboard | 20% Improvement | Monthly | Quality Improvement |
| High-Risk Follow-Up | Dashboard | >95% | Monthly | Care Management |
| Overall Quality Score | Dashboard | Continuous Improvement | Quarterly | Chief Quality Officer |
*KPIs are monitored monthly with quarterly reviews and reported to leadership.